Category: Finance

  • Investigate bank account transaction using Excel Pivot table

    Investigate bank account transaction using Excel Pivot table

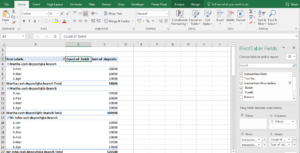
    In this blog post we will use the excel pivot table to investigate bank account transaction. We will try to find dubious or potentially illegal transactions using our data analysis and visualisation. Here we have statement account of John Enterprise for the duration of January 2017 to April 2017. The excel sheet contains columns such as transaction date, transaction no, transaction description, debit, credit and balance. Our first task is to create a pivot table from this account data. Here’s how the table looks like:

    Step 1: We start by creating a basic pivot table:
    (more…)

  • Visualising Stock Market Data with Pivot Table, Conditional Formatting

    Visualising Stock Market Data with Pivot Table, Conditional Formatting

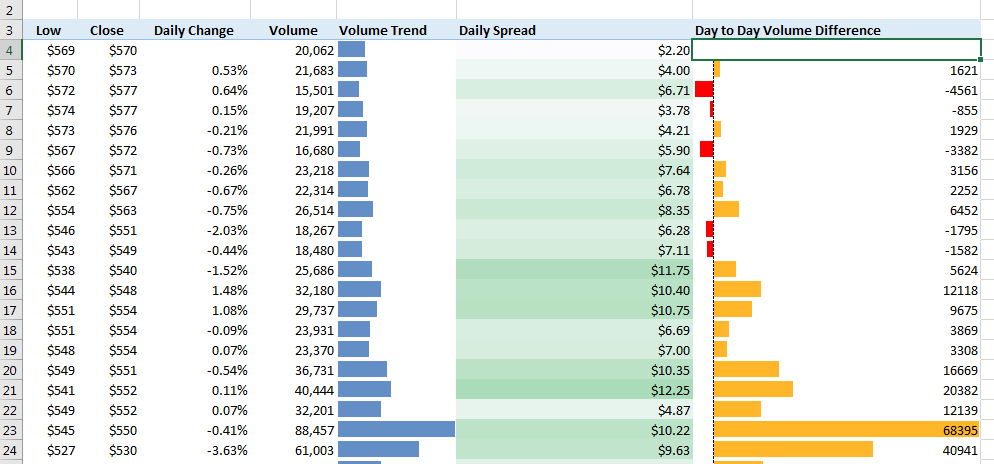
    In this post we will work with stock market data of US stock exchange and using Excel techniques such as

    Sorting & Filtering, Conditional Formatting (Highlight Cells, Data Bars) and Value Settings (% Difference From) We will try to tell a visual story.

    (more…)