Blog

  • Investigate bank account transaction using Excel Pivot table

    Investigate bank account transaction using Excel Pivot table

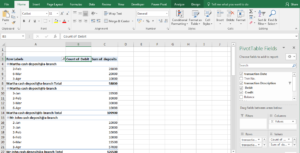
    In this blog post we will use the excel pivot table to investigate bank account transaction. We will try to find dubious or potentially illegal transactions using our data analysis and visualisation. Here we have statement account of John Enterprise for the duration of January 2017 to April 2017. The excel sheet contains columns such as transaction date, transaction no, transaction description, debit, credit and balance. Our first task is to create a pivot table from this account data. Here’s how the table looks like:

    Step 1: We start by creating a basic pivot table:

    (more…)

  • Data Matching and Data Preparation using MS Excel (Match, Index, V-lookup, Conditional Formatting)

    The case in hand is customer retargeting issue for a travel agency company. They have a big list of customers whom they have called once to sell their product and another list of customers who have purchased the offer from the travel agency. In the second list, some customers bought the offer without any effort from the company. Some other customers in the list bought it because of the company’s marketing effort i.e. direct phone calls. Our goal is to match the both datasets and find out the common customers.


    Theoretically that’s not very difficult. Match both tables based on some kind of identification column and voila! But real-world data is not that simple unfortunately. For example, in this case both tables or datasets were recorded by different group of people. Also, information about these phone calls are often missing because customers are not always willing to provide or verify information like address, email etc. Even for phone numbers, which seemingly should be same for a person, differs a lot. Maybe at the time of the first call they used home phone. But at the time of buying they used cell phone. In such case matching by phone number won’t be fruitful.

    (more…)

  • Visualising Stock Market Data with Pivot Table, Conditional Formatting

    Visualising Stock Market Data with Pivot Table, Conditional Formatting

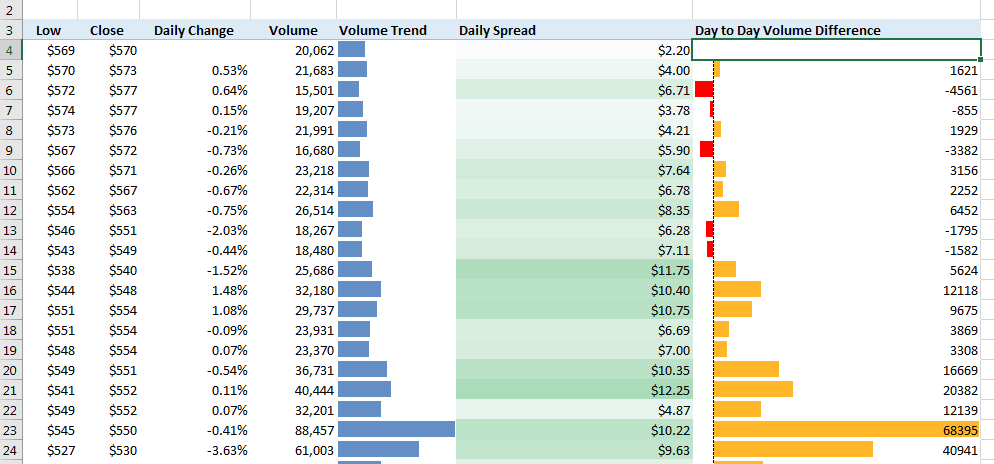
    In this post we will work with stock market data of US stock exchange and using Excel techniques such as

    Sorting & Filtering, Conditional Formatting (Highlight Cells, Data Bars) and Value Settings (% Difference From) We will try to tell a visual story.

    (more…)

  • Creating Dashboard in MS Excel

    Creating Dashboard in MS Excel

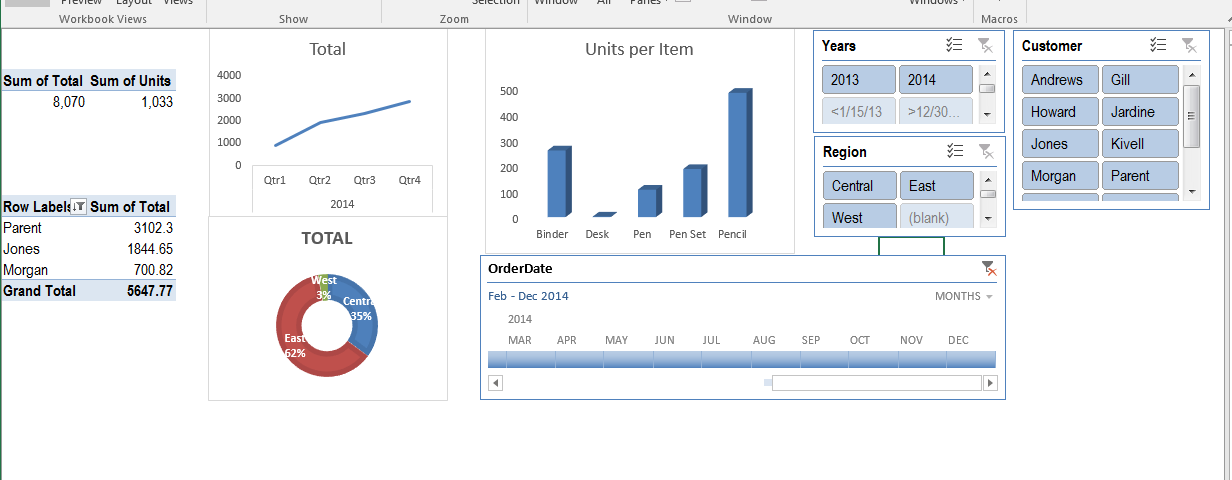
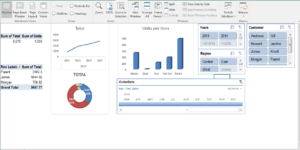
    What is dashboard: A data dashboard is an information management tool that visually tracks, analyzes and displays key performance indicators (KPI), metrics and key data points to monitor the health of a business. Dashboards are customizable to meet the specific needs of a department and company.

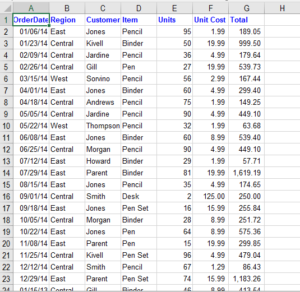
    The dataset: Our sample data set is based on sales record. We can see the column names and data types in the below view.


    Checkout the dashboard:

    (more…)

  • Analyzing Sanfrancisco Salary data using MS Excel

    Analyzing Sanfrancisco Salary data using MS Excel

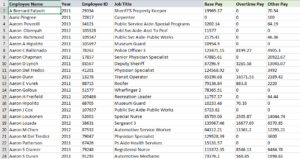
    In this post we are going to analyze Sanfrancisco salary data using MS Excel techniques such as Pivot Table, Calculated Fields, Formatting etc. Below we can see a view of the data set. It contains columns such as Employee name, Year, Employee ID, Job Title, Base Pay, Overtime Pay and Other Pay.

    (more…)

  • Hello world!

    Hello World !!! I am Shihabur. Data Analyst by Training and Profession. Skilled in SAS, SQL, R, MS Excel, data cleaning, data visualisation and data mining. In this website where I will summarise the projects I have been working on, to showcase my portfolio. This is still work in progress. More projects will be added. If you want anything on SAS/SQL/R, please let me know, I will create the content in priority basis. Chao !